
Coverage
Supply divided by demand for CPU, accelerators, RAM, and enterprise SSD.
Coverage is calculated by dividing the modeled supply series by the corresponding demand series for CPU, accelerators, RAM, and enterprise SSD. It is a tightness ratio: 100% means supply and demand are matched, above 100% means supply is ahead, and below 100% means demand is running ahead. The available data runs from 2020 through the modeled horizon.
The companies considered are the same supplier groups used on the Supply pages: Intel, AMD, and Arm server CPU vendors; NVIDIA, AMD Instinct, and captive or merchant ASIC programs; SK hynix, Samsung, and Micron; and Samsung, SK hynix, Kioxia, Sandisk, Micron, and Solidigm for enterprise SSD.
A smaller coverage number means a tighter market. Buyers compete for limited CPU, GPU/ASIC, memory, or server SSD, so lead times stretch, allocation is more common, and vendors have more pricing power. Spot premiums and constrained SKUs show up first in those years. A rising coverage number means the stack is easing: more product is available relative to demand, and pressure on price and delivery typically fades.
Read coverage together with lead time and hyperscaler spend. Coverage says whether the bill of materials can be filled; lead time says how long the channel takes to deliver; hyperscaler CapEx says how fast demand is being funded.
CPU coverage
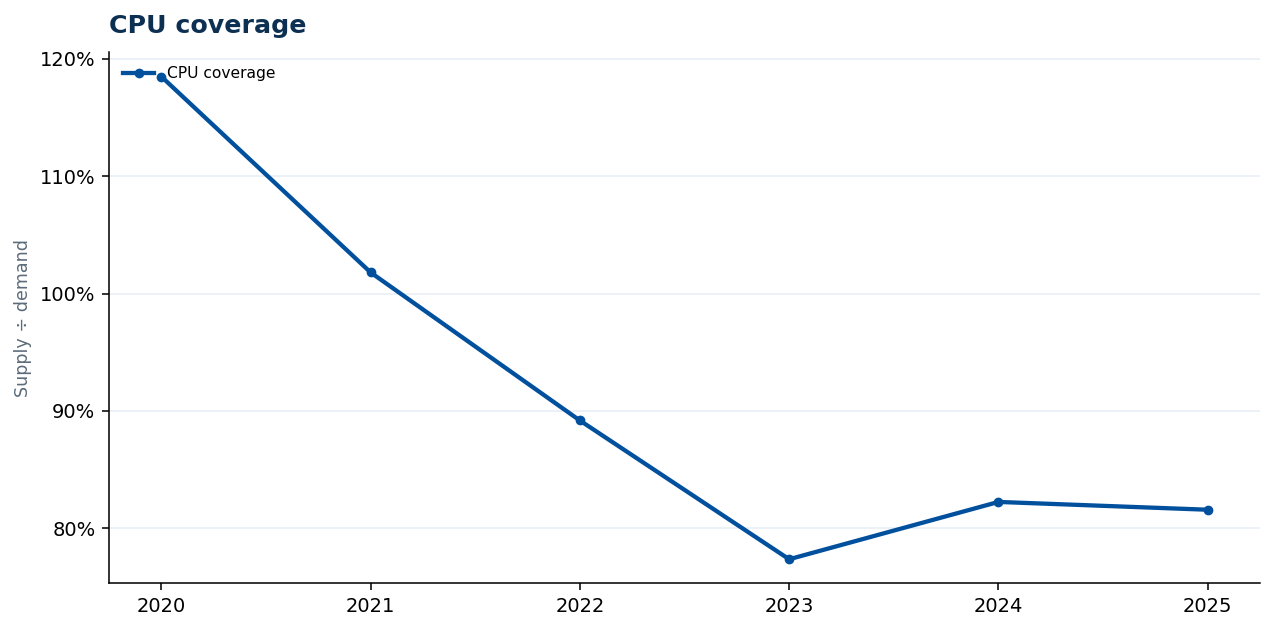
CPU supply ÷ demand. Above 100% = supply ahead of the demand roll-up.
Download PNG · Through 2025
Accelerator coverage
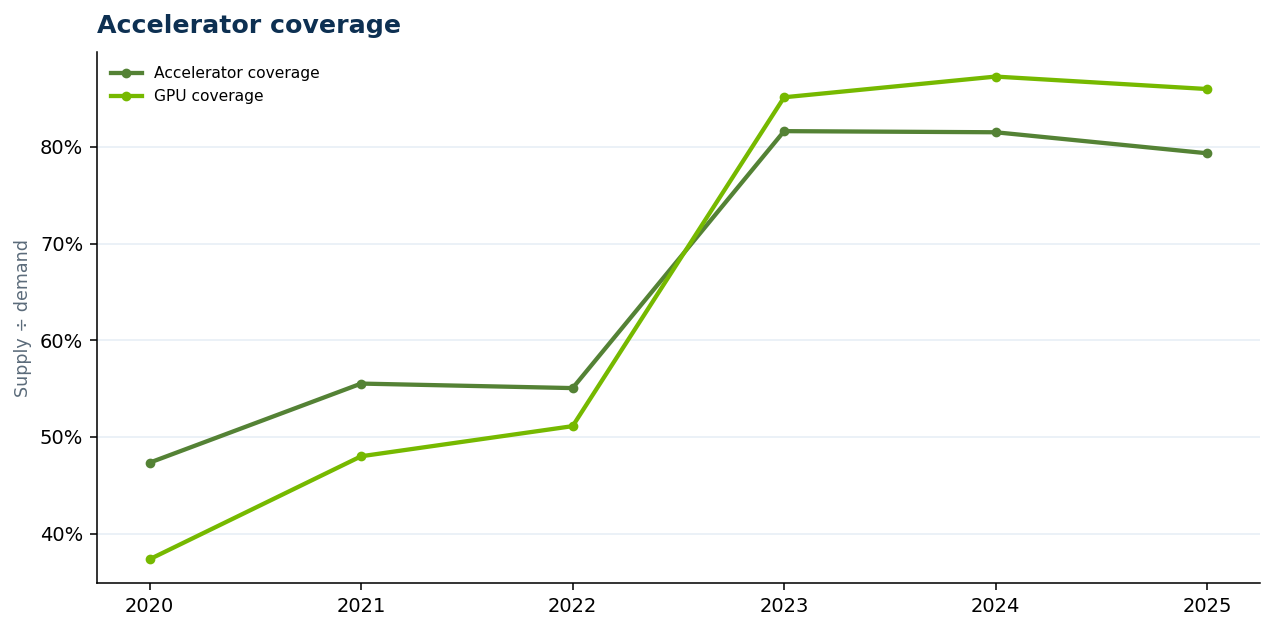
Accelerator supply (GPU + ASIC) ÷ accelerator demand. Above 100% = supply ahead of demand.
Download PNG · Through 2025
RAM coverage
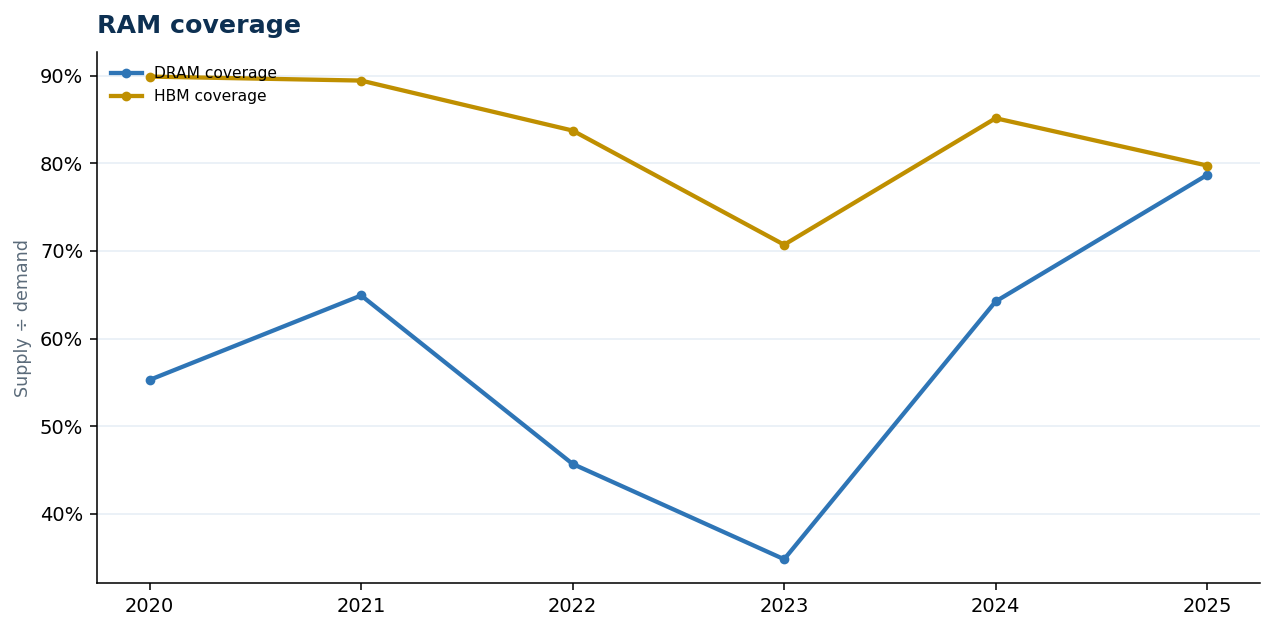
Server DRAM and HBM supply ÷ demand. Above 100% = supply ahead of demand.
Download PNG · Through 2025
SSD coverage
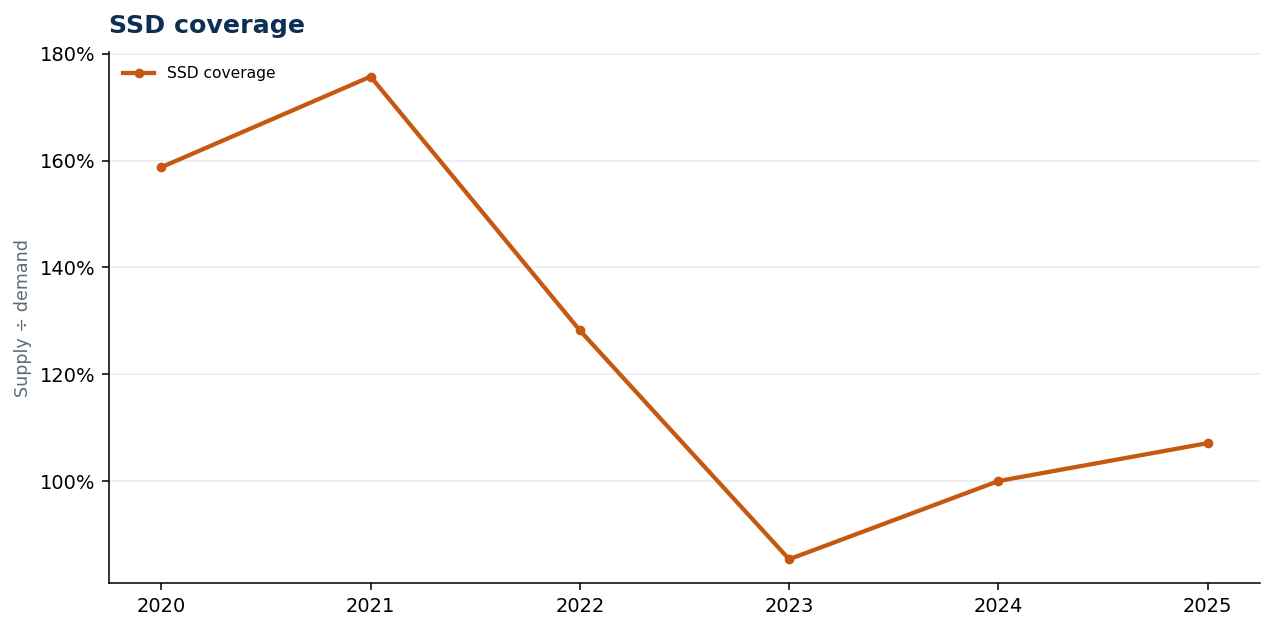
Enterprise SSD supply ÷ demand (server NAND only). Above 100% = supply ahead of demand.
Download PNG · Through 2025
Last model update:
How to interpret this data
Use this signal with the underlying Demand and Supply pages before drawing conclusions about pricing power, availability, or spending momentum.
Related data
Frequently asked questions
What does this page measure?
Supply divided by demand for CPU, accelerators, RAM, and enterprise SSD.
Can JP Data provide a custom company, product, region, or scenario cut?
Yes. Request custom data with the required market boundary, products, companies, geography, and time horizon.