Hyperscaler Spend
Hyperscaler CapEx going back to 2020 — MAG, MANGOS, neoclouds, and the four public hyperscalers.
Hyperscaler spend is collected from company filings, earnings disclosures, capital-expenditure guidance, and research estimates. The page provides annual CapEx groupings and company rows from 2020 onward. MAG is Microsoft, Amazon, and Google; MANGOS adds other large spenders; neoclouds are GPU-centric hosts.
Companies considered include Amazon / AWS, Google, Microsoft, Meta, other large cloud buyers in the MANGOS grouping, and newer AI labs or neoclouds where public disclosures support a research estimate. Google is counted once when it appears in both a grouping name and a company row.
Rising CapEx pulls demand through the stack: more dollars for AI infrastructure mean more CPU, GPU/ASIC, and HBM. If supply coverage is already below 100%, a CapEx surge tightens the market further — longer lead times and stronger vendor pricing. Flattening or falling CapEx eases component demand and is usually the first sign that shortages will loosen.
Hyperscaler CapEx
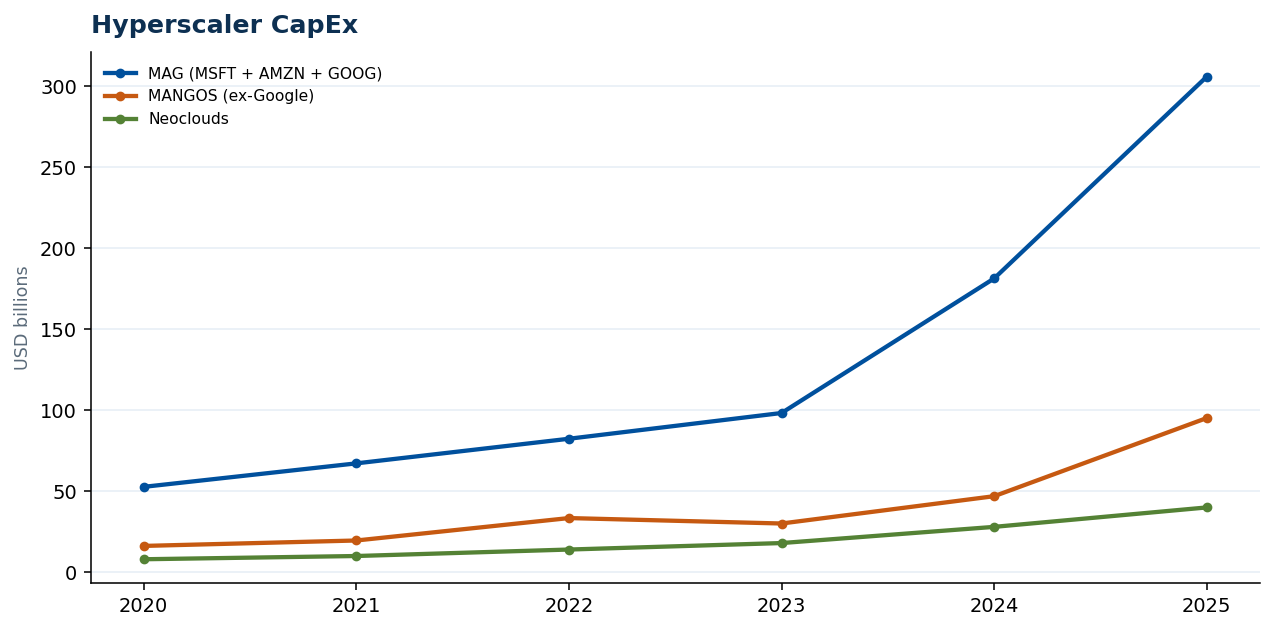
HyperScalerCapex: MAG, MANGOS (Google excluded from the MANGOS sum), and neoclouds. Company rows below.
Download PNG · Through 2025
Hyperscaler CapEx by company
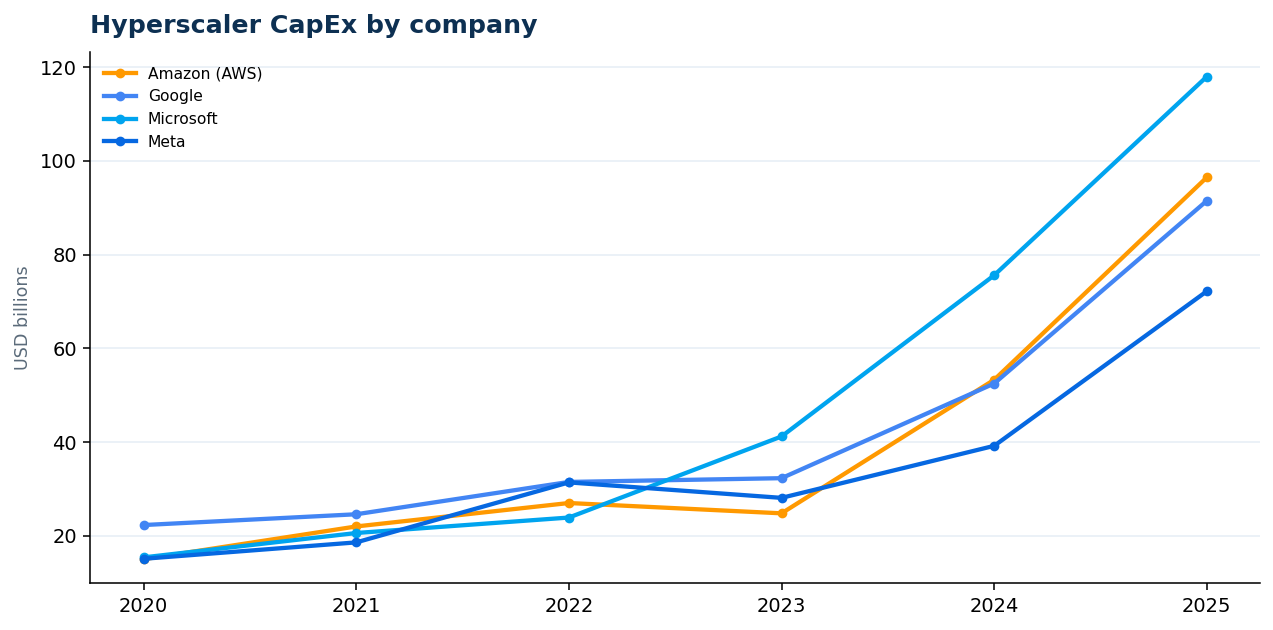
AWS, Google, Microsoft, and Meta link CapEx_Annual. Anthropic / OpenAI / SpaceX are yellow estimates.
Download PNG · Through 2025
Last model update:
How to interpret this data
Use this signal with the underlying Demand and Supply pages before drawing conclusions about pricing power, availability, or spending momentum.
Related data
Frequently asked questions
What does this page measure?
Hyperscaler CapEx going back to 2020 — MAG, MANGOS, neoclouds, and the four public hyperscalers.
Can JP Data provide a custom company, product, region, or scenario cut?
Yes. Request custom data with the required market boundary, products, companies, geography, and time horizon.