
A signal is a current reading of market conditions. Market size says how large the business was. A signal says whether buyers can get the product, how long they wait, and whether the next wave of spending is still being funded.
JP Data publishes three signals for data-center AI infrastructure.
Coverage
Coverage is supply divided by demand for server CPUs, accelerators, DRAM, and enterprise SSDs. One hundred percent means the two sides match. A lower number is a tighter market: buyers compete for product, orders move onto allocation, and vendors have more room to hold price. A higher number means product is easier to get, and that pressure fades.
Lead time
Lead time is the modeled number of weeks to deliver a CPU, a GPU, or high-bandwidth memory. It describes channel availability. A longer lead time means orders have to be placed earlier. In 2025 the model is 12 weeks for CPUs, 26 weeks for GPUs, and 36 weeks for high-bandwidth memory. GPU lead time peaked at 39 weeks in 2023. High-bandwidth memory peaked at 42 weeks in 2024.
Hyperscaler spend
Hyperscaler spend is the capital expenditure that pays for the next servers. MAG — Microsoft, Amazon, and Google — rose from $52.7 billion in 2020 to $306 billion in 2025. Neoclouds, the GPU-centric hosts, rose from $8 billion to $40 billion. Rising spend pulls CPU, accelerator, and memory demand through the stack. When coverage is already under 100%, that extra spend tightens the market further. When spend flattens, component demand eases, and that is usually the first sign a shortage will loosen.
How to gauge the market
Read the three together. Coverage says whether this year’s bill of materials can be filled. Lead time says how long delivery takes. Hyperscaler spend says how fast next year’s demand is being funded.
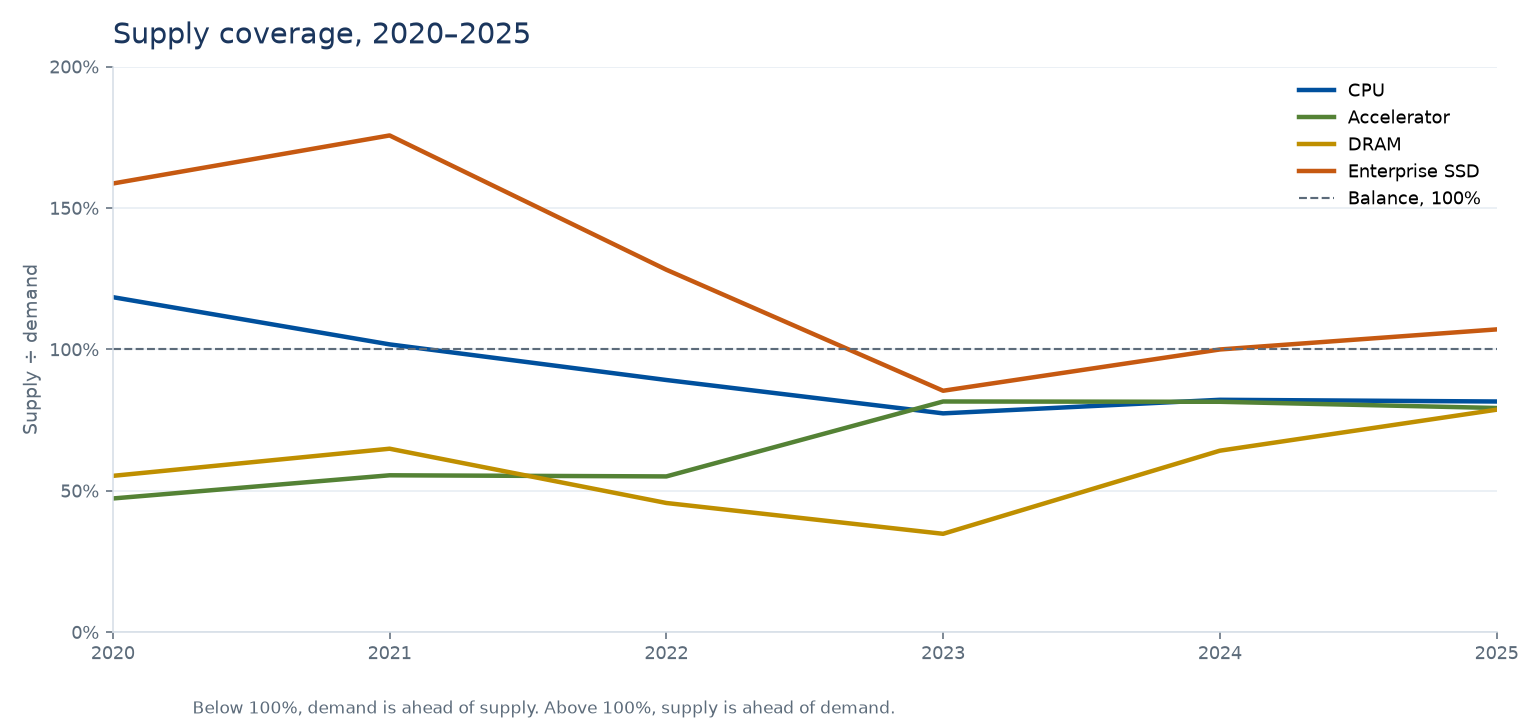
The chart is coverage from 2020 through 2025. In 2025, CPU coverage is 82%, accelerators are 79%, and DRAM is 79%. Enterprise SSD is 107%, above balance. DRAM was the tightest point in the period, at 35% in 2023, and has since eased. Accelerators have improved from 47% in 2020 and remain short of demand. CPUs started in surplus, at 118% in 2020, and stand at 82% in 2025. High-bandwidth memory, tracked separately from the DRAM line above, is at 80% coverage in 2025.
The 2025 reading is straightforward. Capital spending is still rising, three of the four components are still below balance, and high-bandwidth memory is still the longest wait.