
This dataset puts server vendor revenue and buyer cash capex next to each other. Server vendor revenue is the supply side. Buyer fiscal capex is the cash the named companies spent. They are different objects. The combined view — servers counted once, then IT and the eight components — starts in 2015. The data starts in 1994 and forecasts through 2032. In 2025, the server total market was $444 billion and buyer fiscal capex was $435 billion.
The market, 1994–2032
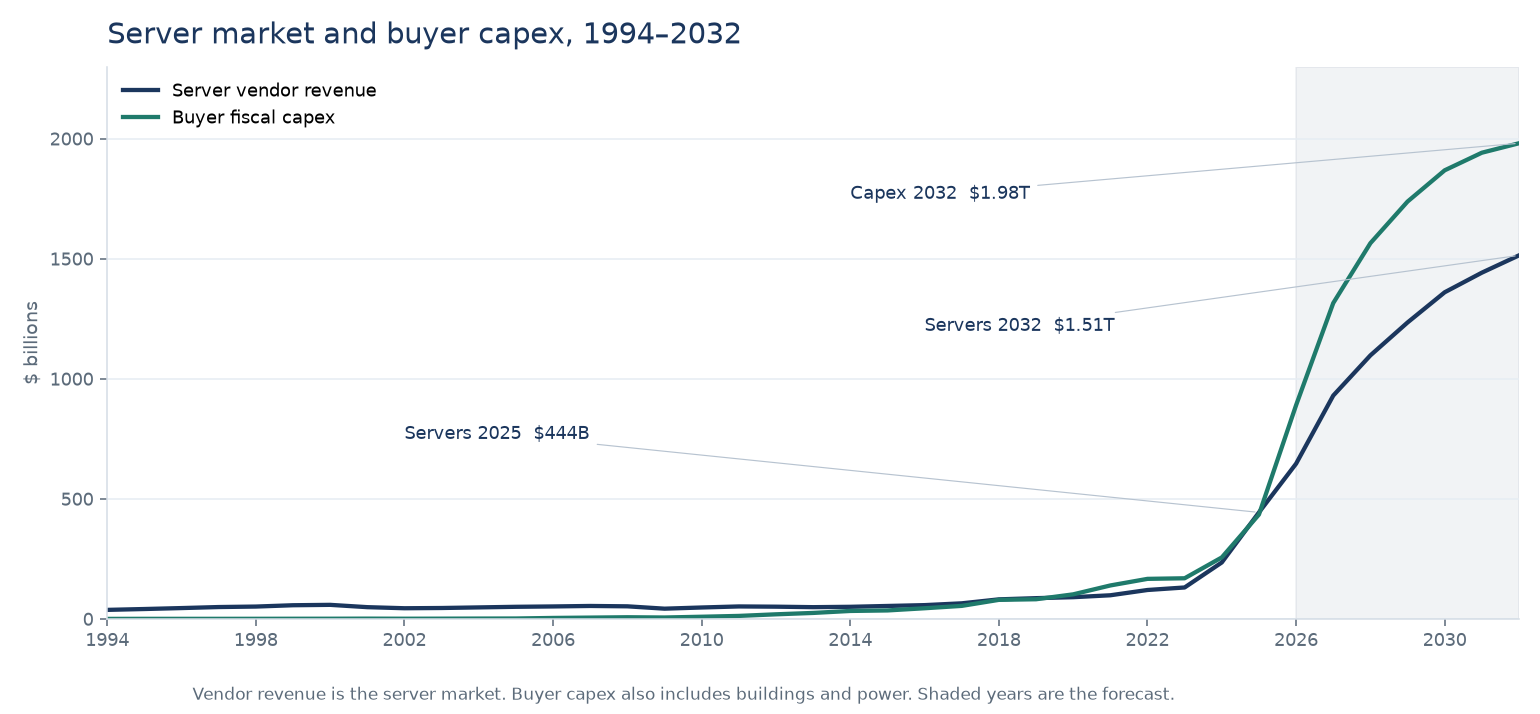
In 1994 the server market is $38.2 billion and the four public buyers spend $689 million. The buyers are not the market. The server line is $50 billion in 1997, the existing model from 1998, $444 billion in 2025, and $1.51 trillion in 2032. The capex line is $435 billion in 2025 and $1.98 trillion in 2032. Capex climbs through the server line because the later years include buildings, power, and shells, and because the fiscal-year sum is not a server bill of materials.
Data set details
The two series. Every year from 1994 through 2032 has server vendor revenue, the sum of buyer fiscal capex, and the count of buyers with a figure. Microsoft and Oracle are also shown calendarised, half and half for Microsoft and five months against seven for Oracle. In 1994 that calendar pair is $387 million and $257 million.
The combined model. In 2025, IT is $685 billion, servers are $458 billion, of which the seventeen buyers are $248 billion, and accelerators are $192 billion. In 2026 those are $1,191 billion, $794 billion, $538 billion, and $368 billion. In 2030 they are $2,410 billion, $1,609 billion, $1,050 billion, and $790 billion. In 2032 they are $2,616 billion, $1,750 billion, $1,110 billion, and $878 billion. Those figures start in 2015.
Where the other files stop. The buyer file is cash capex, with a bill of materials from 1998. The OEM file is vendor revenue, with a bill of materials from 1998. This file is the place the two totals can be read together. The overlap shares that keep a server from being counted twice live in the working total.
Narratives and documents. The data set is accompanied by articles that explain the method, the drivers, the constraints, the companies, and what to watch.