
This dataset is worldwide server vendor revenue, the supply side of the same machines the buyer model counts from capex. The thing being counted is what server vendors invoice. ODM Direct is the unbranded channel, not the sum of the contract manufacturers’ own revenue. The data starts in 1994 and forecasts through 2032. In 2025, the total market was $444.1 billion. From 2026 the market follows the forecast already in the workbook, then a deceleration through 2032.
The market, 1994–2032
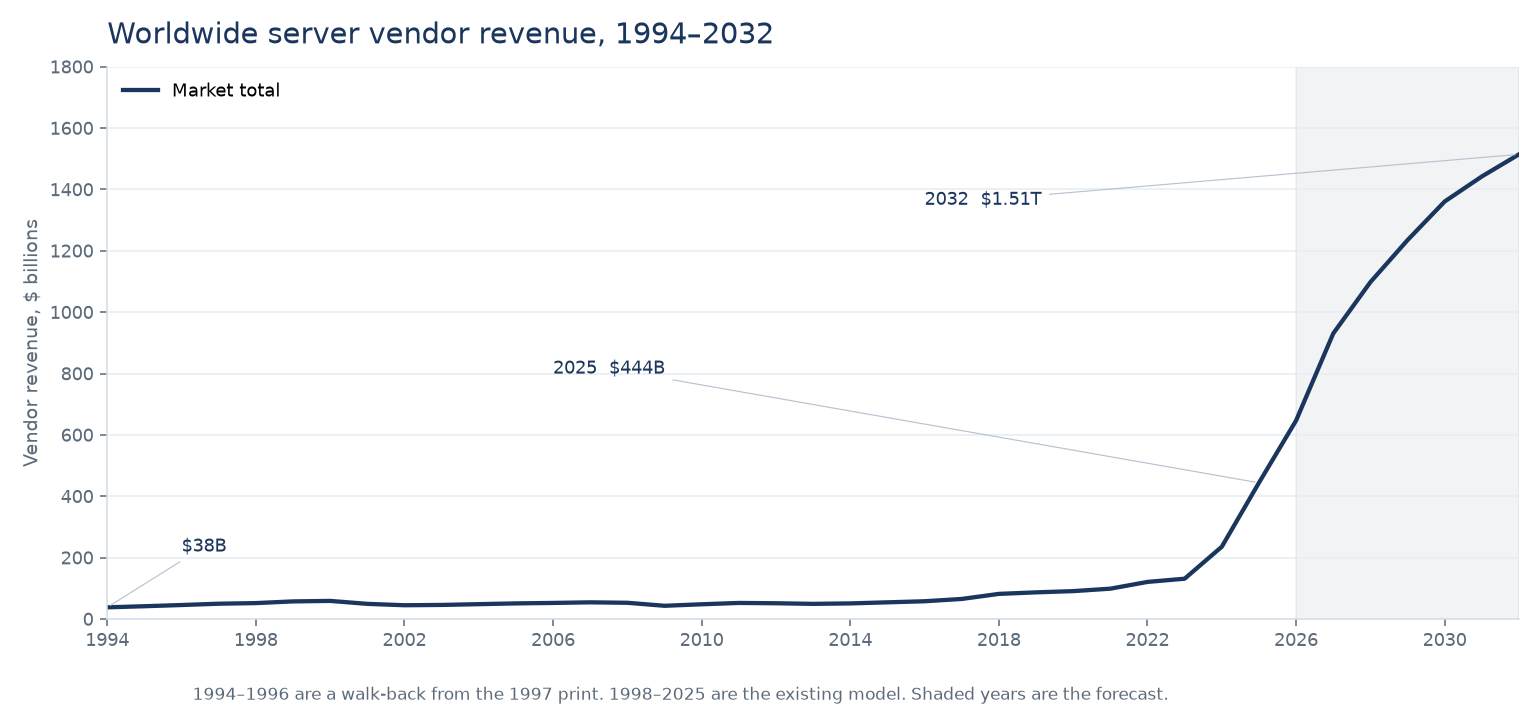
1997 is $50 billion, IBM’s statement of that year’s worldwide server business, hardware only. 1994, 1995, and 1996 walk that total back at 9.4 percent a year, so they are estimates: $38.2 billion, $41.8 billion, and $45.7 billion. The model resumes at $52 billion in 1998 and the total market is $444.1 billion in 2025. The forecast ends at $1.51 trillion in 2032.
The bill of materials, 1994–2032
Each chart below is a line from the same sheet, in billions of dollars, from 1994 through 2032. The component split and server hardware start in 1998. Vendor revenue, the top line, runs from 1994. The years from 2026 are the forecast, shaded on the chart. Every component chart also carries server hardware, so the bucket can be read against the hardware budget it sits inside. Server hardware also includes network silicon, other chips, and assembly, test, and margin. The last chart places that hardware line under vendor revenue.
GPU
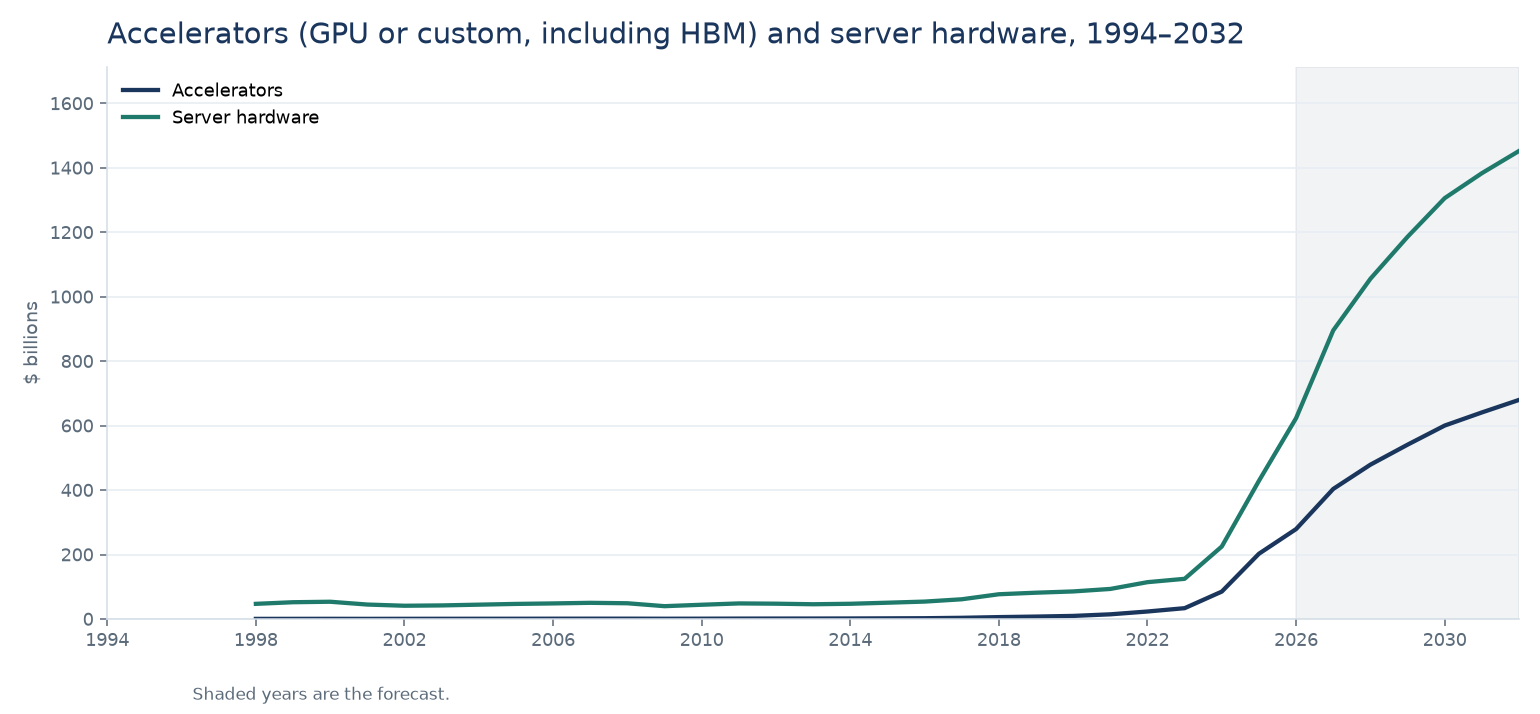
The GPU line is accelerators, GPU or custom silicon, and it includes the high-bandwidth memory on the package. It is $541 million in 1998, $203 billion in 2025, and $680 billion in 2032. Server hardware in those years is $47.2 billion, $429 billion, and $1.45 trillion.
CPU
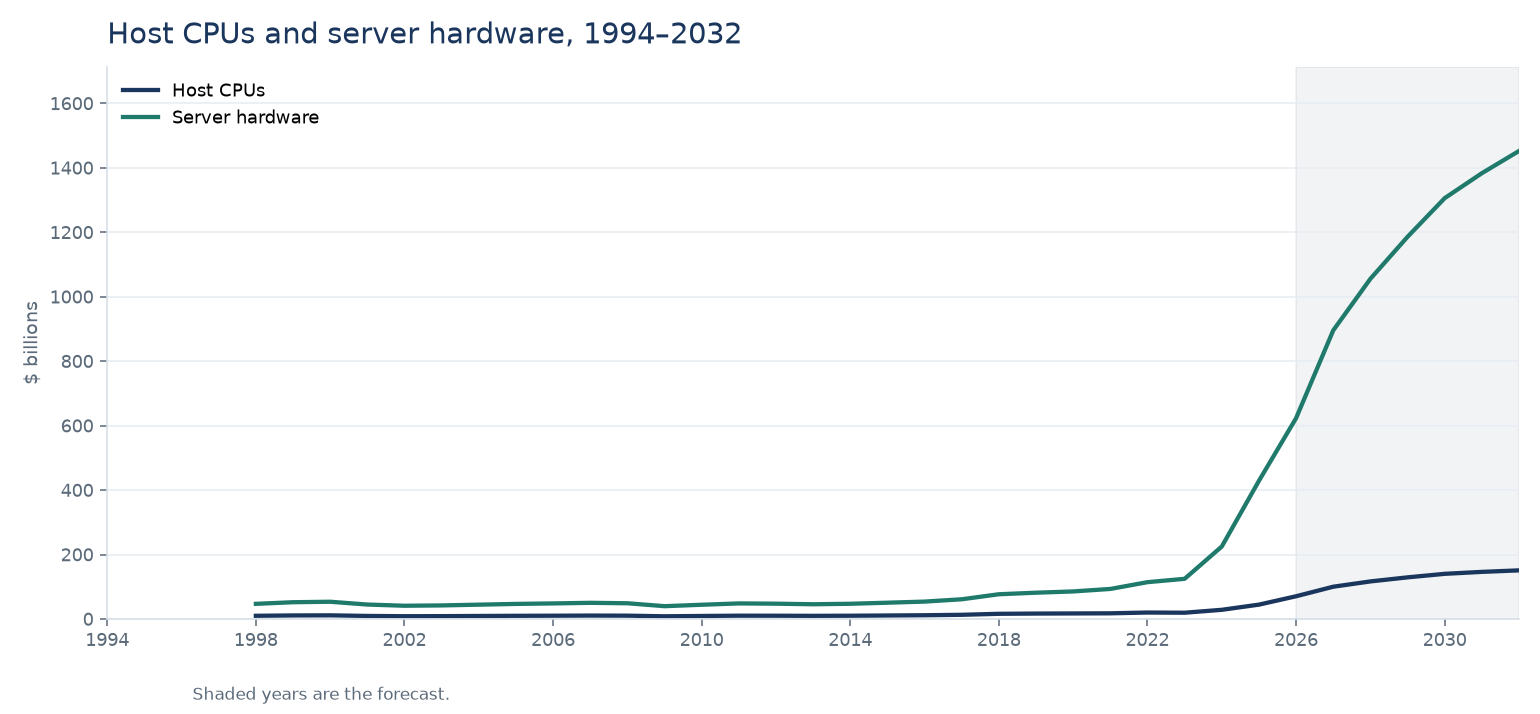
Host CPUs are $10.1 billion in 1998, $44.7 billion in 2025, and $151 billion in 2032.
DRAM
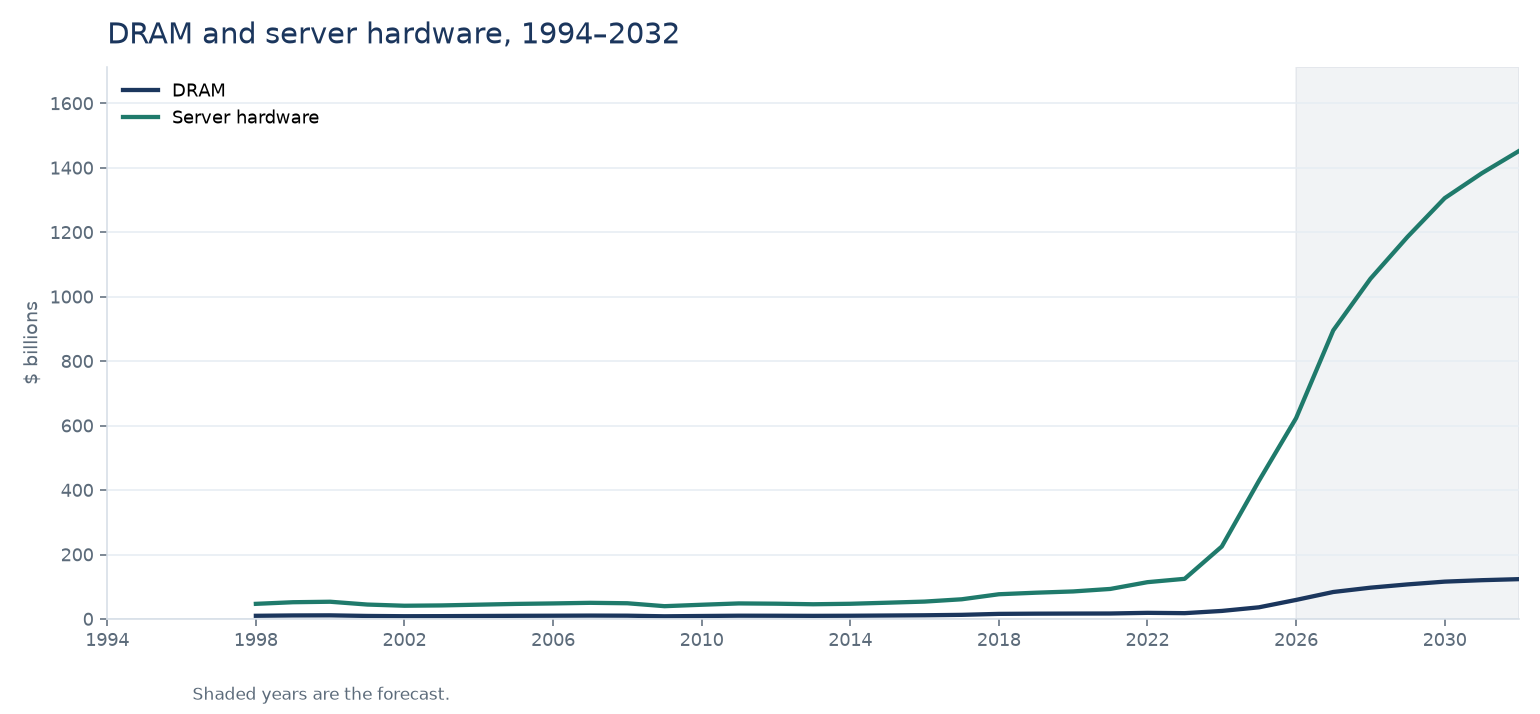
This DRAM line is host memory. High-bandwidth memory is counted on the GPU line. Host DRAM is $10.1 billion in 1998, $36.4 billion in 2025, and $124 billion in 2032.
Storage
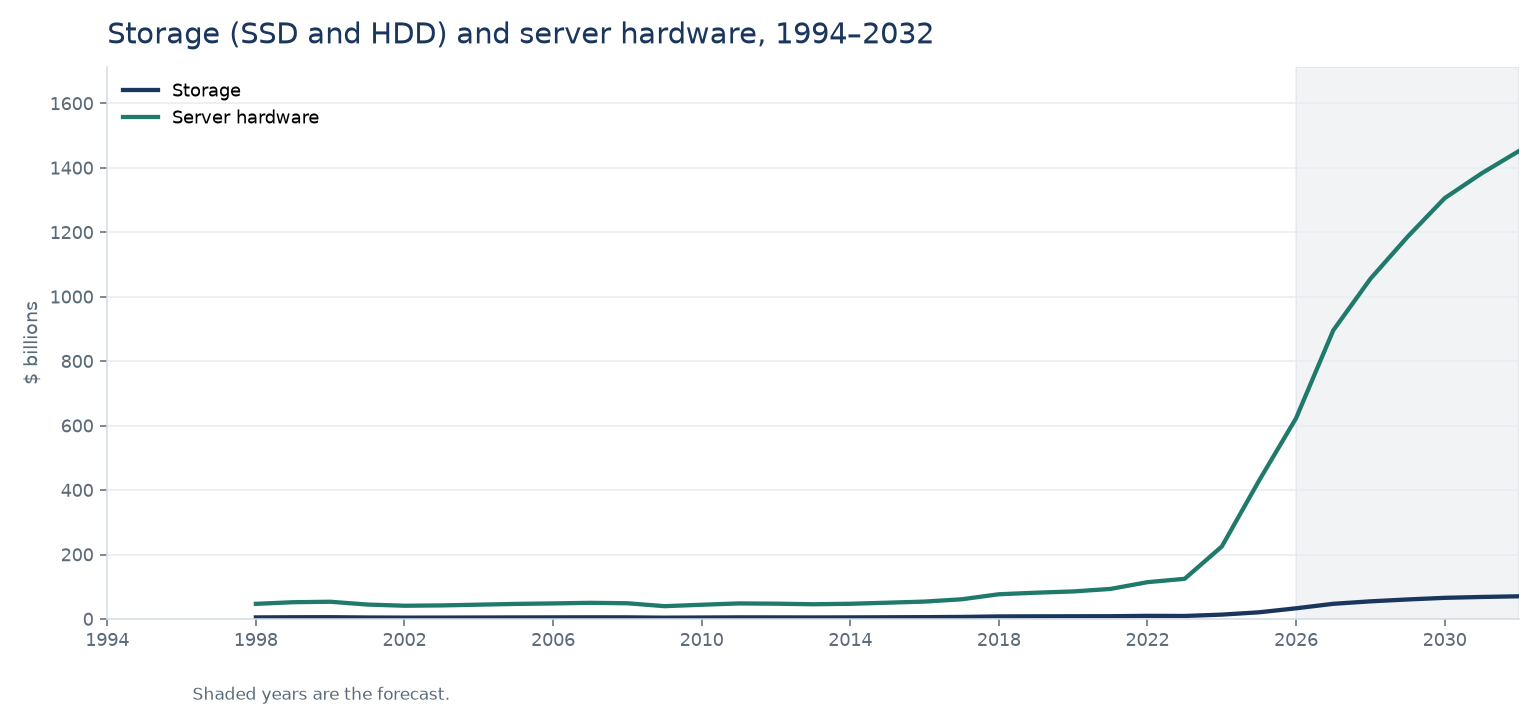
Storage is the SSD and hard-drive content of the server. It is $5.1 billion in 1998, $20.9 billion in 2025, and $70.6 billion in 2032.
Rack and power
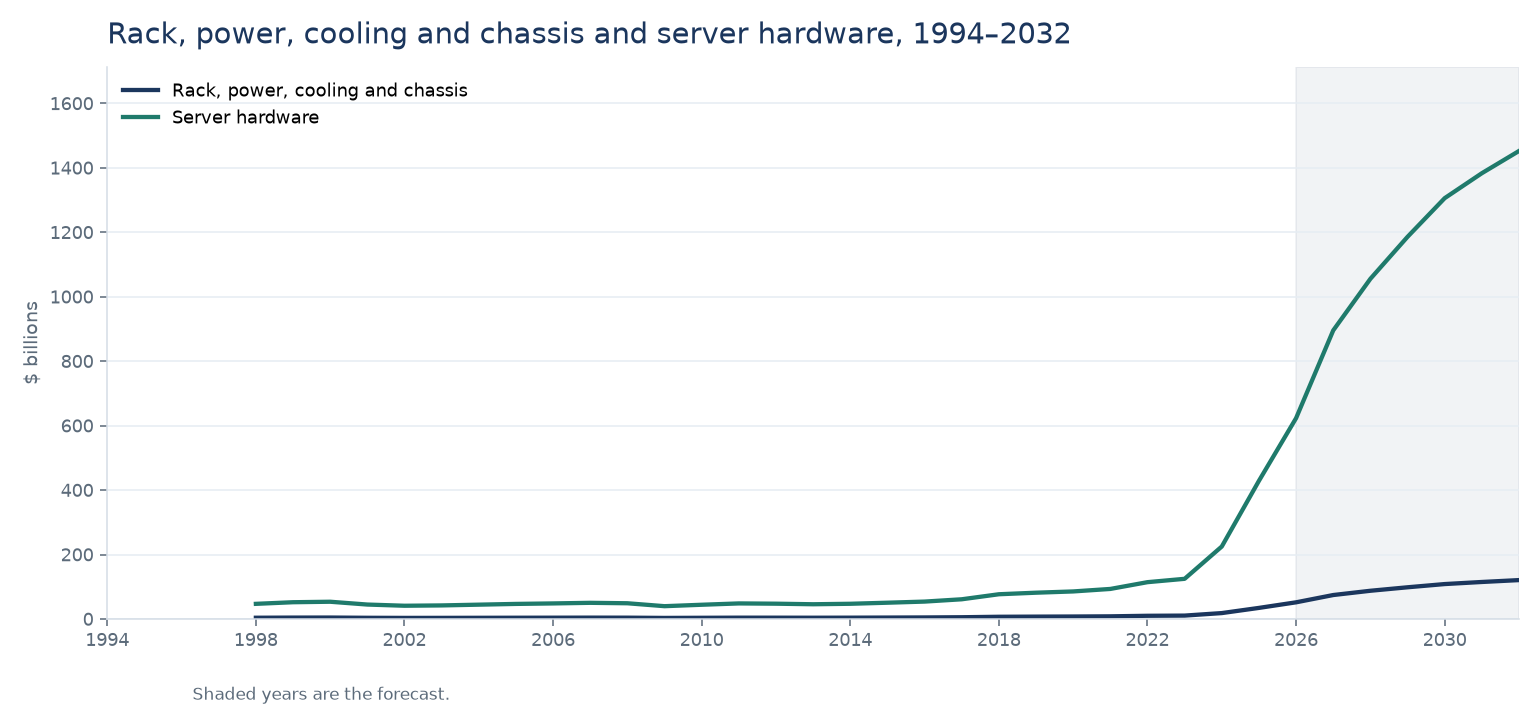
Rack and power here is the rack, power, cooling, and chassis content of server hardware. It is $4.1 billion in 1998, $34.6 billion in 2025, and $121 billion in 2032.
Server hardware and vendor revenue
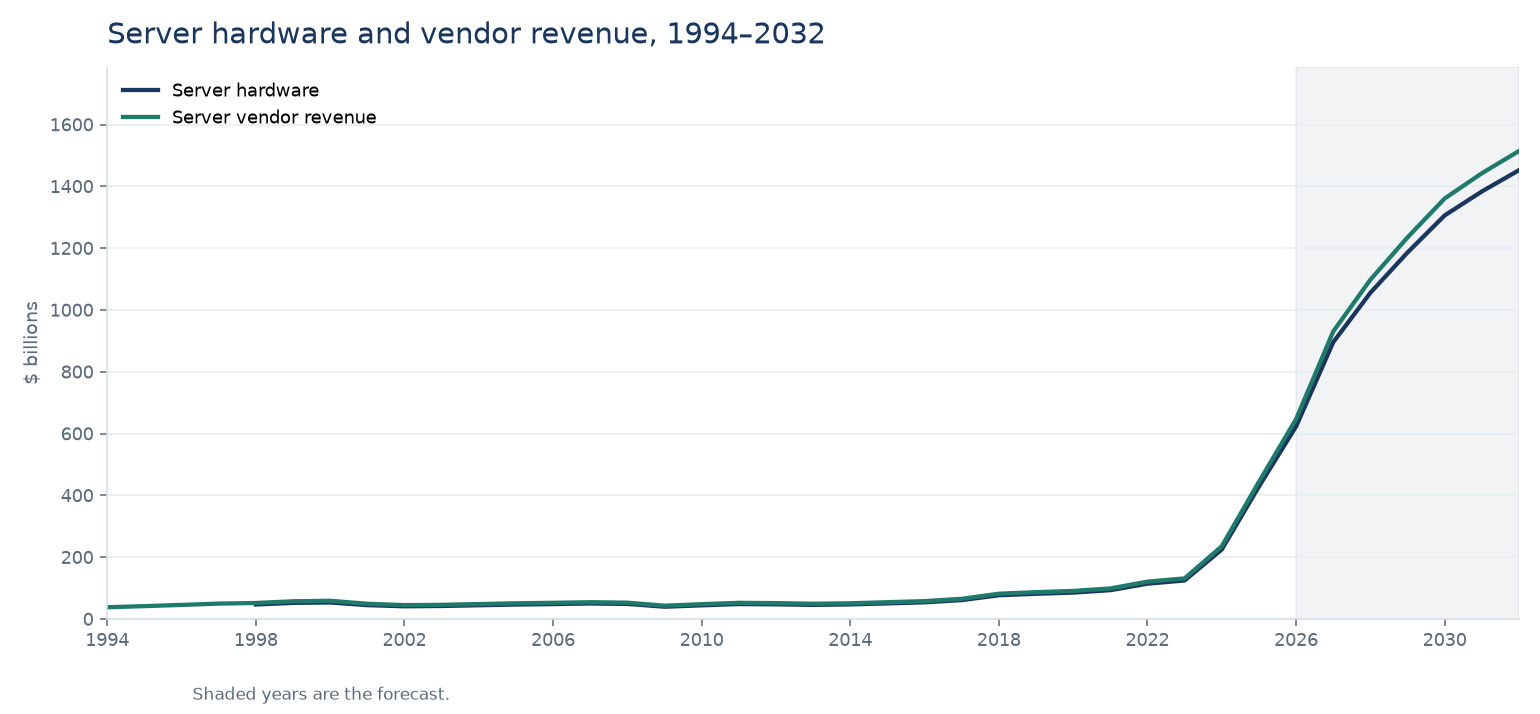
Server hardware is $47.2 billion in 1998, $429 billion in 2025, and $1.45 trillion in 2032. Vendor revenue is the top line: $38.2 billion in 1994, $52 billion in 1998, $444.1 billion in 2025, and $1.51 trillion in 2032. Services and the non-server lines inside reported vendor revenue sit between the two. The years 1994 through 1997 have vendor revenue and no hardware split.
Data set details
The model. Every year from 1994 through 2032 has a market total. Yellow years are the 1994–1996 walk-back or a forecast year. Blue years are the 1997 print or a year carried unchanged from the existing model.
The forecast. The haircut from vendor revenue to hardware, the three server types, and the eight components start in 1998. They are not pushed back onto the 1994–1997 print.
Key players. For 1994–1997 the named dollars are the 1997 print: IBM $11.5 billion, HP $4 billion, Sun $3.2 billion, and Compaq together with DEC and Tandem at $5 billion. Earlier years scale those four with the market. The rest of the year’s total sits in an unallocated column. From 1998 the columns are the existing vendor history, Dell through the long tail plus ODM Direct, and from 2026 they follow the same share path as the forecast. Other OEM is the plug that makes each year add up. Sun at $3.2 billion in the 1997 print and Sun at about $10 billion in the 1998 model are different definitions, and the file keeps both.
Narratives and documents. The data set is accompanied by articles that explain the method from 1998 forward, the drivers, the constraints, the companies, and what to watch.