
This dataset is the cash capital expenditure of the companies in the buyer-side model. The thing being counted is purchases of property and equipment, on the fiscal year each company reports. Server spend and the bill of materials start in 1998, once an IT share is applied. The data starts in 1994 and forecasts through 2032. The years through 2025 are filings. From 2026 the same columns carry the forecast, and a filed year replaces a forecast. In 2025, the total across the seventeen companies is $435 billion.
The market, 1994–2032
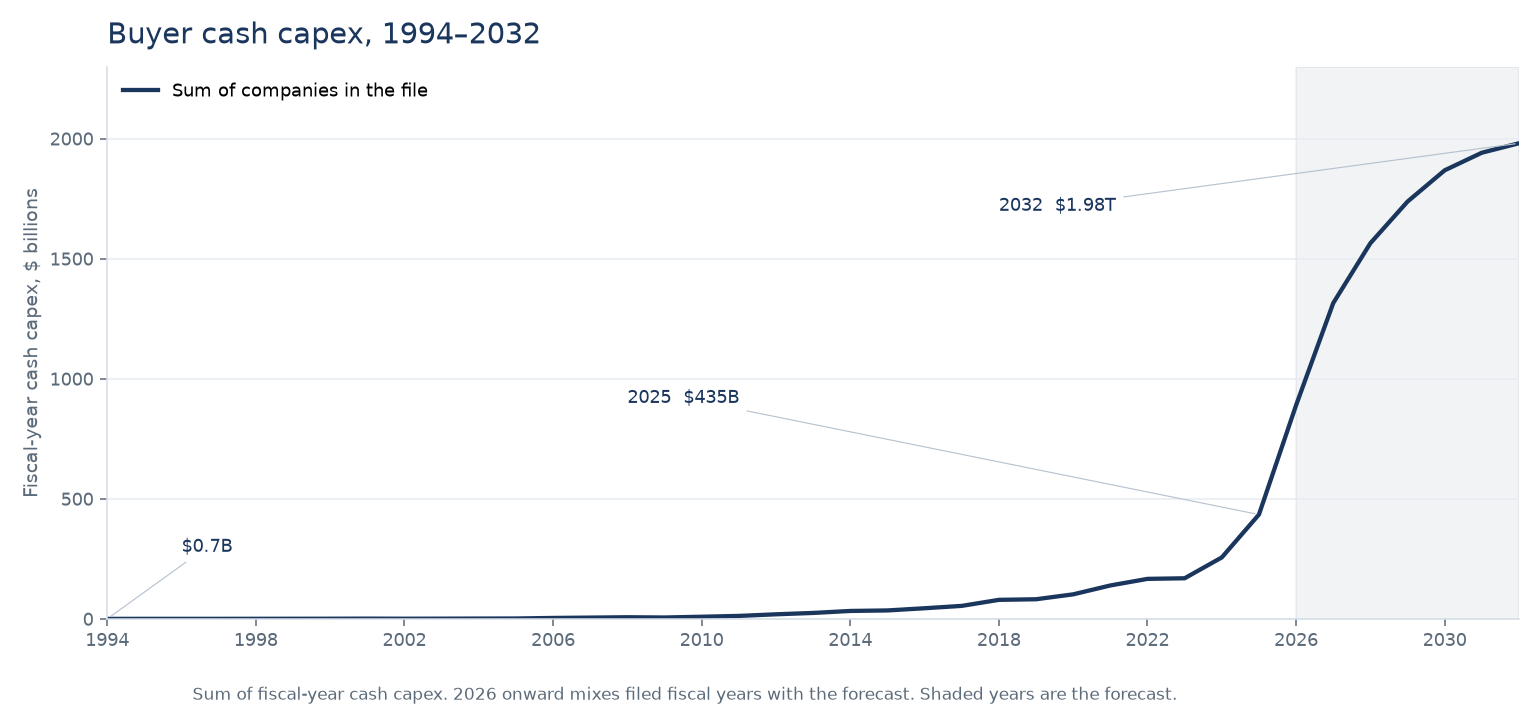
In 1994 the file holds Microsoft at $278 million, Apple at $160 million, Oracle at $251 million, and Amazon at $28 thousand for the months after 5 July. The sum is $689 million. Alphabet, Meta, and the neoclouds are blank, because they did not yet exist as filers. In 2025 the fiscal-year sum across the seventeen companies is $435 billion. The forecast, which calendarises Microsoft and Oracle, puts the same seventeen at $468 billion. By 2032 the fiscal-year sum is $1.98 trillion. The big four’s 2026 plans of about $733 billion are a guidance total on each company’s own basis, and they are not the height of this line.
The bill of materials, 1994–2032
Each chart below is a line from the same sheet, in billions of dollars, from 1994 through 2032. The component split and server spend start in 1998, once an IT share is applied. Capex is filled from 1994. The years from 2026 are the forecast, shaded on the chart. Every component chart also carries server spend, so the bucket can be read against the server budget it sits inside. Server spend itself also includes network silicon, other chips, and assembly and margin. The last chart places that server line under total capex. Capex on these charts is the calendarised total the bill of materials is built on: $804 million in 1994, $468 billion in 2025, and $1.99 trillion in 2032.
GPU
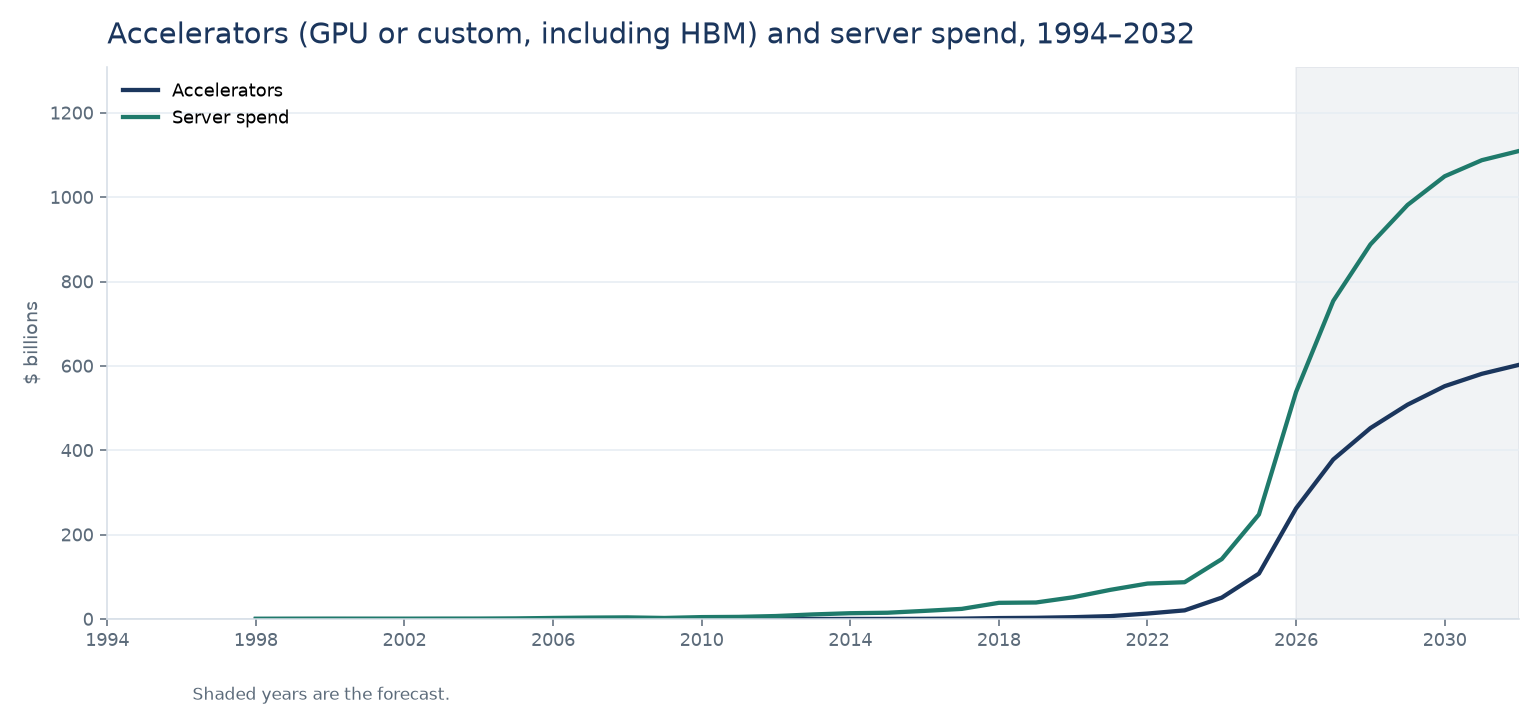
The GPU line is accelerators, GPU or custom silicon, and it includes the high-bandwidth memory on the package. It is zero from 1998 through 2012 and $82 million in 2013. In 2025 it is $108 billion, against server spend of $248 billion. The forecast is $603 billion in 2032, against server spend of $1.11 trillion.
CPU
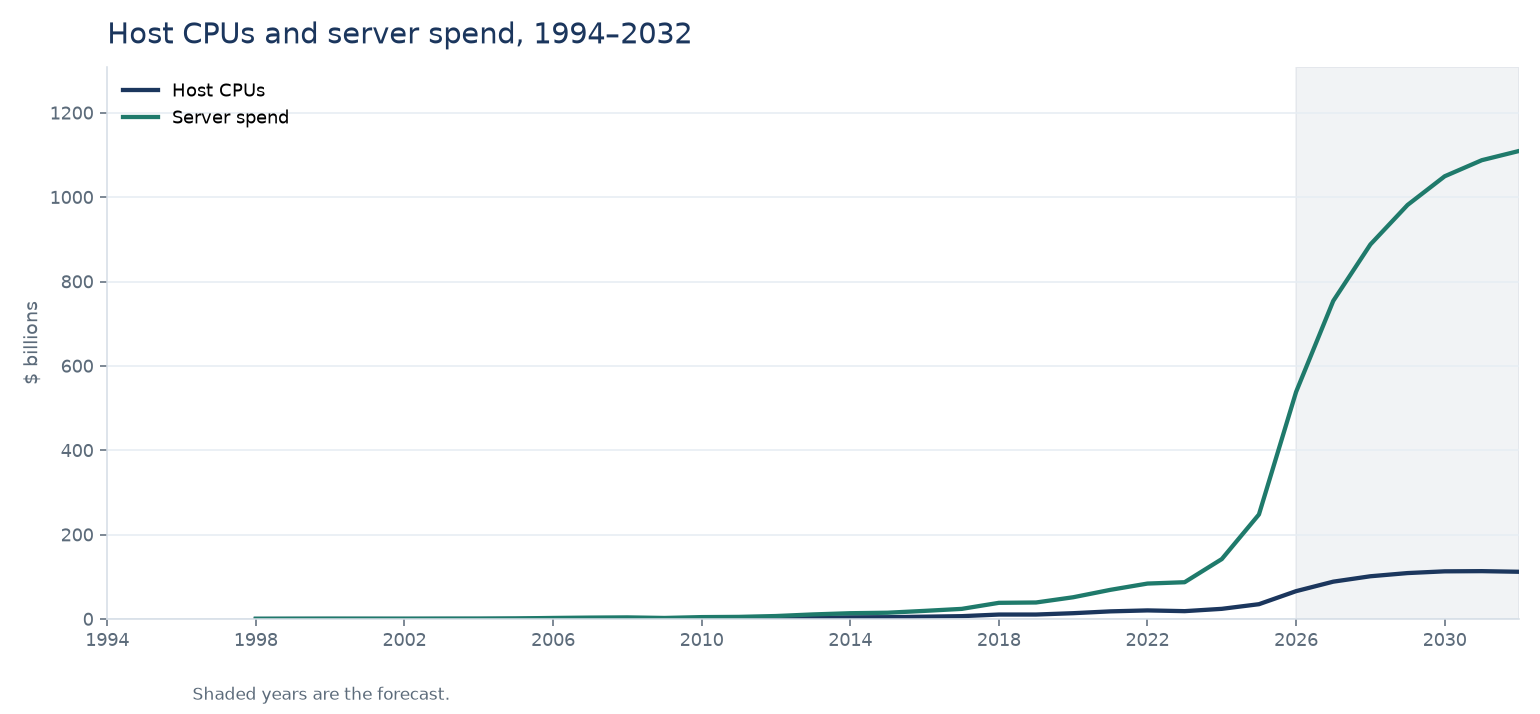
Host CPUs are $191 million in 1998, $35.2 billion in 2025, and $112 billion in 2032. The same years of server spend are $636 million, $248 billion, and $1.11 trillion.
DRAM
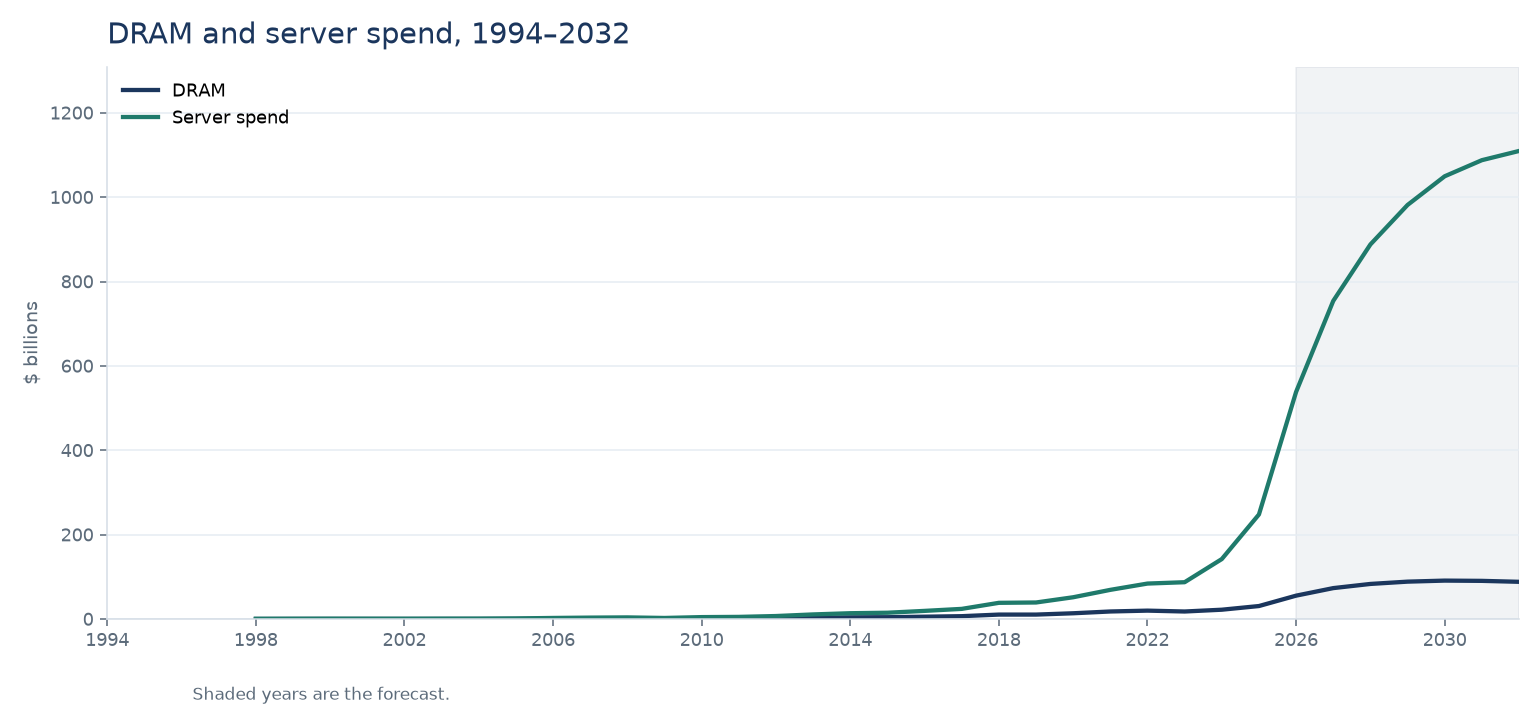
This DRAM line is host memory. High-bandwidth memory is counted on the GPU line. Host DRAM is $191 million in 1998, $30.8 billion in 2025, and $91.1 billion in 2030. The 2032 forecast is $88.3 billion.
Storage
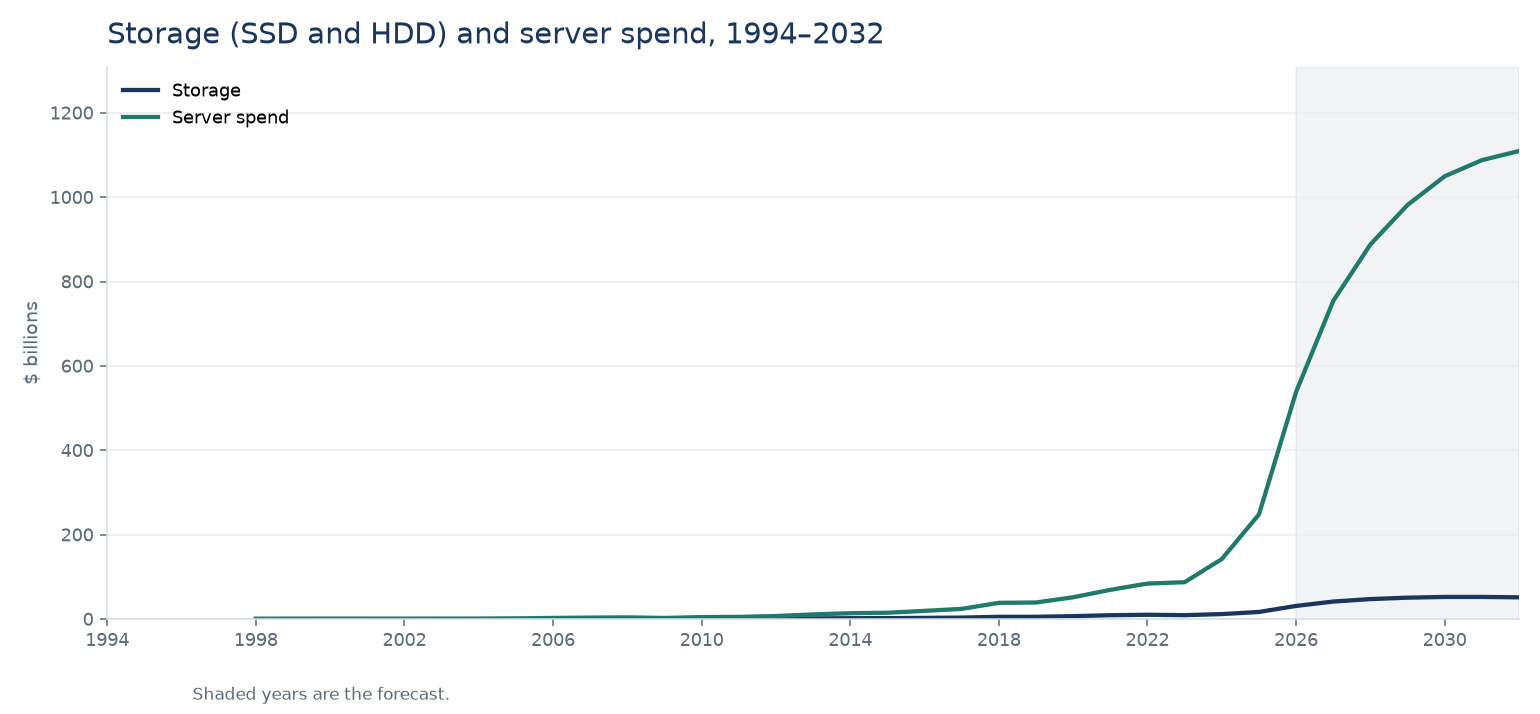
Storage is the SSD and hard-drive content of the server. It is $95 million in 1998, $16.8 billion in 2025, and $52.4 billion in 2030. The 2032 forecast is $51.5 billion.
Rack and power
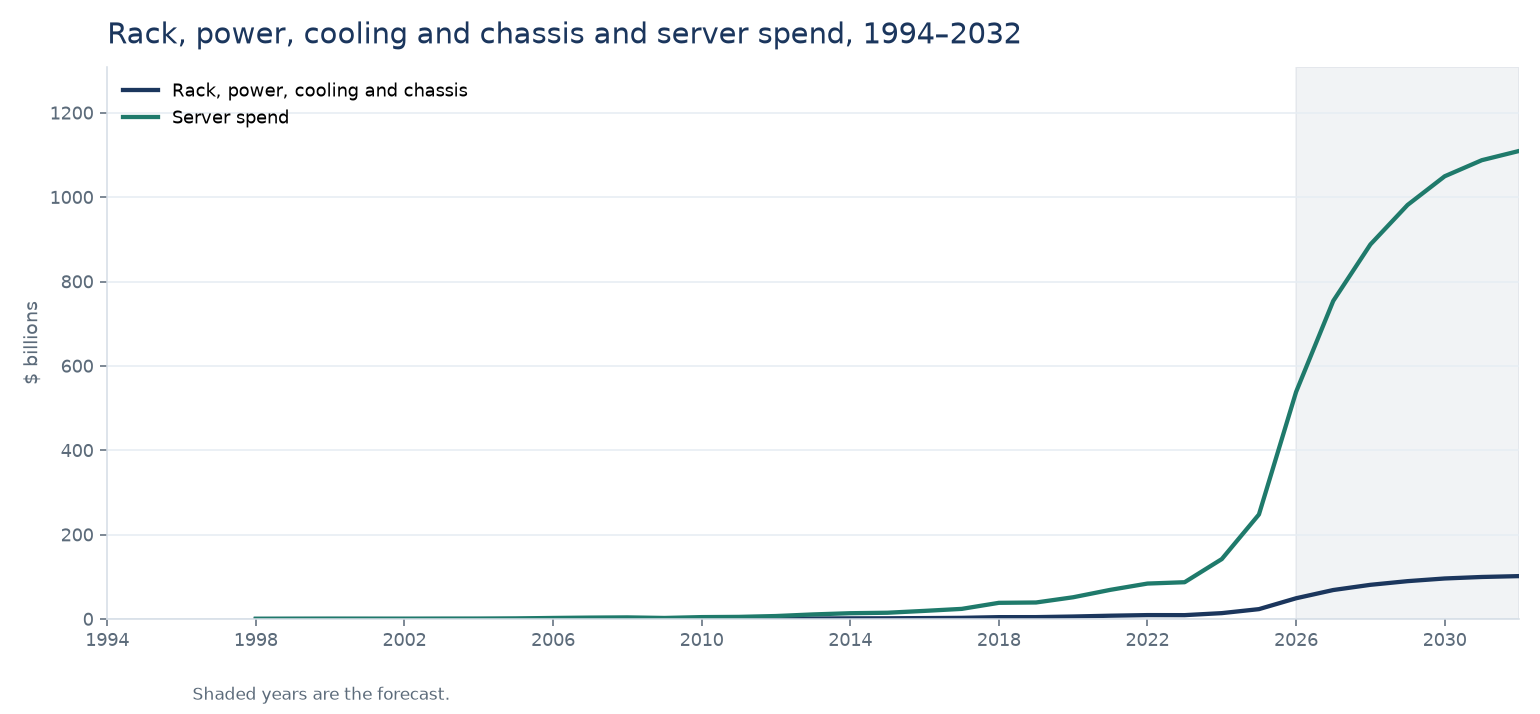
Rack and power here is the rack, power, cooling, and chassis content of server spend. It is $76 million in 1998, $23.5 billion in 2025, and $102 billion in 2032.
Server spend and total capex
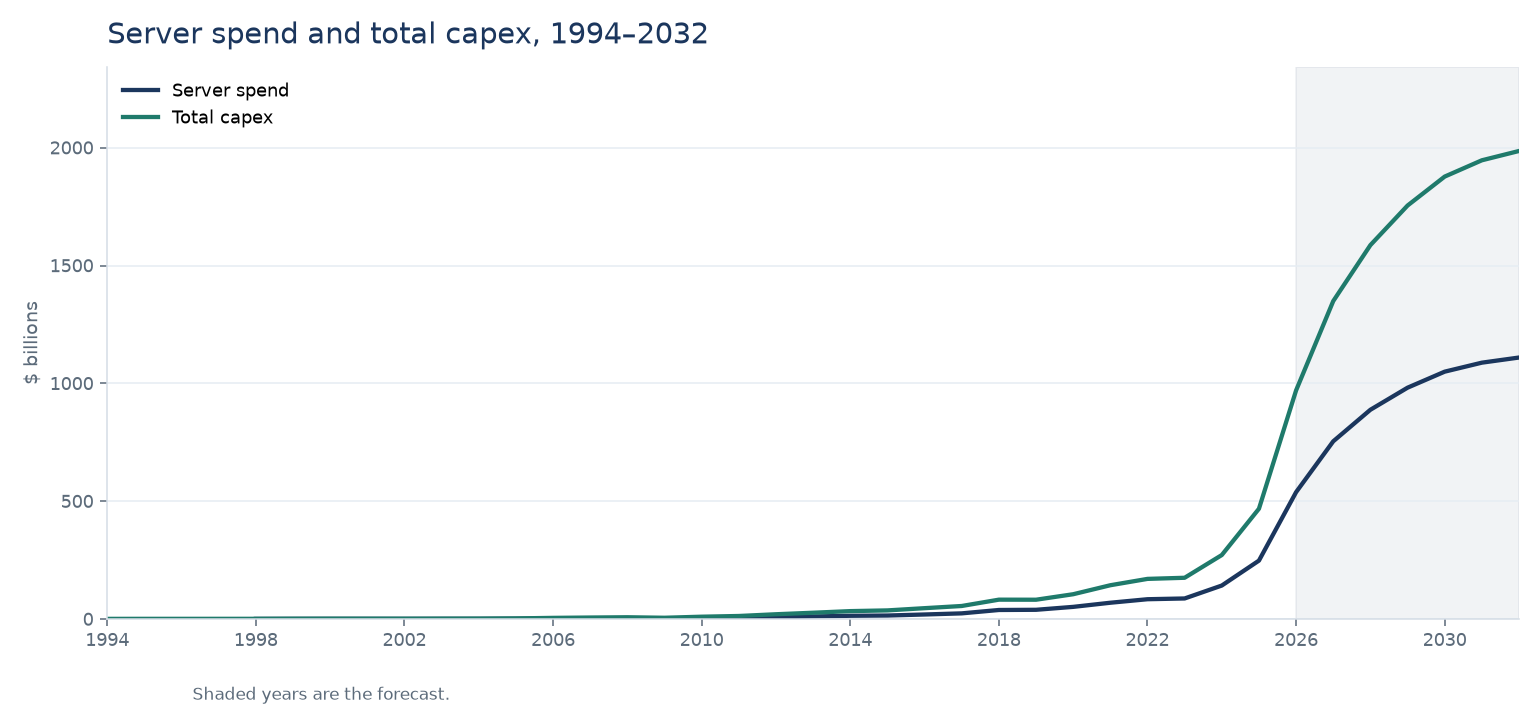
Server spend is $636 million in 1998, $248 billion in 2025, and $1.11 trillion in 2032. Total capex is the top line: $804 million in 1994, $468 billion in 2025, and $1.99 trillion in 2032. Buildings, power, and the rest of IT sit between those two lines. The years 1994 through 1997 have capex and no server split.
Data set details
The model. One row per fiscal year from 1994 through 2032, and one column per company. A blank cell is a company that was not yet reporting. The total on each row sums only the cells that have a figure. Blue numbers are filings. Yellow numbers are the 2026–2032 forecast. Microsoft 1998 is $656 million, Apple $46 million, Oracle $328 million, and Amazon $28 million.
Key players. Microsoft, Apple, and Oracle run the whole way, on June, September, and May year-ends. Amazon starts with a partial year in 1994. Nvidia’s first year in the file is 1999. Alphabet starts in 2001, Meta in 2007, and the neoclouds and SpaceX in the 2020s. Microsoft is weighted half and half and Oracle five months and seven months before quarterly filings exist. Apple is left on its September year.
The forecast. The walk from capex to IT capex, server spend, and the eight components starts in 1998. The shares that drive it describe today’s infrastructure mix. Microsoft’s 1994 figure is campuses and computer systems for a software company.
Narratives and documents. The data set is accompanied by articles that explain the method from 1998 forward, the drivers, the constraints, the companies, and the disclosures to watch.